Multiple Choice
Exhibit 2-3.A city in California spent six million dollars repairing damage to its public buildings in 2010.The following table shows the categories where the money was directed. 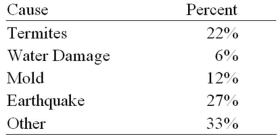 Refer to Exhibit 2-3.How much did the city spend to fix damage caused by mold?
A) $360,000
B) $720,000
C) $1,440,000
D) $1,800,000
Correct Answer:

Verified
Correct Answer:
Verified
Q23: What graphical tool is best used to
Q28: For which of the following data sets
Q51: A stem-and-leaf diagram is constructed by separating
Q55: In the following pie chart representing a
Q56: Exhibit 2-5.The following data represent scores on
Q59: What type of relationship is indicated in
Q61: Exhibit 2-4.Students in Professor Smith's Business Statistics
Q62: The following stem-and-leaf diagram shows the speeds
Q63: Exhibit 2-5.The following data represent scores on
Q65: Exhibit 2-11.The accompanying relative frequency distribution represents