Multiple Choice
Exhibit 2-7.Thirty students at Eastside High School took the SAT on the same Saturday.Their raw scores are given next. 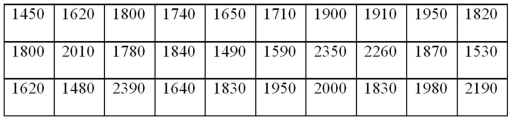 Refer to Exhibit 2-7.Consider a frequency distribution of the data that groups the data in classes of 1400 up to 1600,1600 up to 1800,1800 up to 2000,and so on.How many students scored at least 1800 but less than 2000?
A) 3
B) 7
C) 12
D) 18
Correct Answer:

Verified
Correct Answer:
Verified
Q32: The percent frequency of a category equals
Q81: The accompanying table shows students' scores from
Q82: Exhibit 2-8.Consider the following frequency distribution. <img
Q85: When displaying quantitative data,what is an ogive
Q87: For quantitative data,a cumulative frequency distribution records
Q88: A frequency distribution for qualitative data groups
Q89: Construct a stem-and-leaf diagram with the following
Q90: Exhibit 2-9.An analyst constructed the following frequency
Q91: Exhibit 2-14.In the accompanying stem-and-leaf diagram,the values
Q120: Frequency distributions may be used to describe