Multiple Choice
The following graphic of residential housing data (selling price and size in square feet) is a _____________. 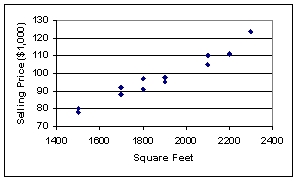
A) scatter plot
B) Pareto chart
C) pie chart
D) cumulative histogram
E) cumulative frequency distribuion
Correct Answer:

Verified
Correct Answer:
Verified
Related Questions
Q19: A histogram can be described as a
Q31: The United Nations Development Programme website provides
Q32: A recent survey of U.S.automobile owners showed
Q34: The 2010 and 2012 market share data
Q36: Suppose a market survey of 200 consumers
Q37: The staff of Ms.Tamara Hill,VP of Technical
Q38: Each day,the manager at Jamie's Auto Care
Q38: An instructor made a frequency table
Q68: A cumulative frequency distribution provides a running
Q72: A scatter plot is useful for examining