Multiple Choice
The United Nations Development Programme website provides comparative data by country on key metrics,such metrics as life expectancy over time.The table below show data on life
Expectancy over time in the United States. 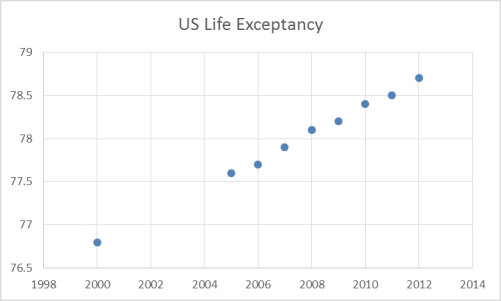 Which of the following statements are not true based on the scatterplot of U.S.Life Expectancy
Over time?
A) The life expectancy in the U.S.is increasing over time.
B) U.S.citizens lived fewer years in 2010 than they did in in 2008.
C) The scatterplot shows an increasing trend in life expectancy in the U.S.
D) Based on the scatterplot,one can assume the life expectancy in 2014 will be higher
Than 78 years.
E) All of the above statements are true.
Correct Answer:

Verified
Correct Answer:
Verified
Q19: A histogram can be described as a
Q27: The staff of Mr.Wayne Wertz,VP of Operations
Q29: The following graphic of PCB Failures is
Q32: A recent survey of U.S.automobile owners showed
Q34: The 2010 and 2012 market share data
Q35: The following graphic of residential housing data
Q36: Suppose a market survey of 200 consumers
Q46: In contrast to quantitative data graphs that
Q72: A scatter plot is useful for examining
Q89: An instructor made a frequency table