Multiple Choice
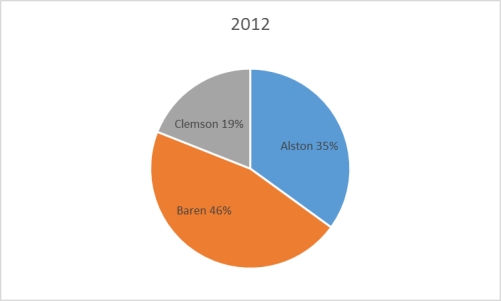
The 2010 and 2012 market share data of the three competitors (Alston,Baren,and Clemson) in an oligopolistic industry are presented in the following pie charts.Total sales for this industry were $1.5 billion in 2010 and $1.8 billion in 2012.Clemson's sales in 2010 were ___________. 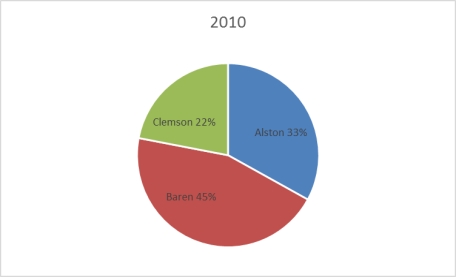
A) $342 million
B) $630 million
C) $675 million
D) $828 million
E) $928 million
Correct Answer:

Verified
Correct Answer:
Verified
Q19: A histogram can be described as a
Q29: The following graphic of PCB Failures is
Q31: The United Nations Development Programme website provides
Q32: A recent survey of U.S.automobile owners showed
Q35: The following graphic of residential housing data
Q36: Suppose a market survey of 200 consumers
Q37: The staff of Ms.Tamara Hill,VP of Technical
Q38: Each day,the manager at Jamie's Auto Care
Q68: A cumulative frequency distribution provides a running
Q72: A scatter plot is useful for examining