Multiple Choice
The following graphic of residential housing data (selling price and size in square feet) indicates _____________. 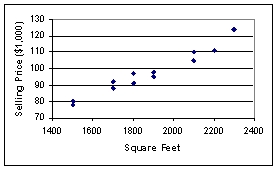
A) an inverse relation between the two variables
B) no relation between the two variables
C) a direct relation between the two variables
D) a negative exponential relation between the two variables
E) a sinusoidal relationship between the two variables
Correct Answer:

Verified
Correct Answer:
Verified
Q3: The cumulative frequency for a class is
Q20: The staff of Mr.Wayne Wertz,VP of Operations
Q21: The following graphic of cigarettes smoked (sold)per
Q24: The following is a bar chart of
Q25: The 2010 and 2012 market share data
Q27: The staff of Mr.Wayne Wertz,VP of Operations
Q45: One rule that must always be followed
Q48: A scatter plot is a two-dimensional graph
Q69: A scatter plot shows how the numbers
Q89: An instructor made a frequency table