Multiple Choice
The 2010 and 2012 market share data of the three competitors (Alston,Baren,and Clemson) in an oligopolistic industry are presented in the following pie charts. 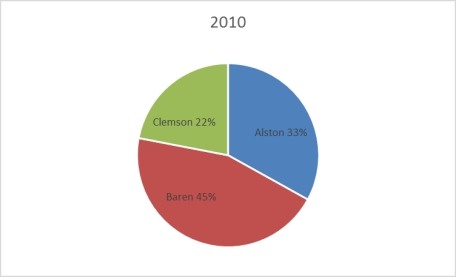
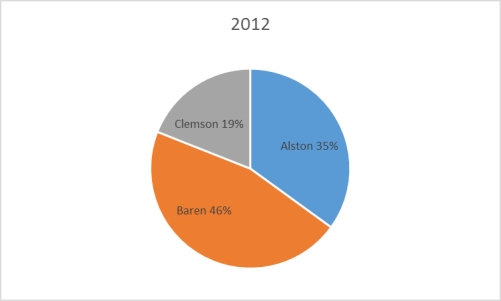 Which of the following may be a false statement?
A) Sales revenues declined at Clemson.
B) Only Clemson lost market share.
C) Alston gained market share.
D) Baren gained market share.
E) Both Alston and Baren gained market share
Correct Answer:

Verified
Correct Answer:
Verified
Q3: The cumulative frequency for a class is
Q19: A histogram can be described as a
Q20: The staff of Mr.Wayne Wertz,VP of Operations
Q21: The following graphic of cigarettes smoked (sold)per
Q22: The following graphic of residential housing data
Q24: The following is a bar chart of
Q27: The staff of Mr.Wayne Wertz,VP of Operations
Q29: The following graphic of PCB Failures is
Q46: In contrast to quantitative data graphs that
Q89: An instructor made a frequency table