Multiple Choice
You can visit the official website of any large restaurant chain to examine the nutritional data for menu items. For fast-food restaurants, many menu items are high in fat, so most of their calorie content comes from fat (rather than from carbohydrates or protein) . Here we investigate the relationship between the amount of fat in a menu item (in grams) and the number of calories. To predict the number of calories in a menu item given its fat content, we use the simple linear regression model calories = + (fat) , where the deviations are assumed to be independent and Normally distributed, with mean 0 and standard deviation . At one major fast-food restaurant chain, there were 26 items listed under the heading of "Sandwiches" (which includes hamburgers, chicken sandwiches, and other sandwich selections) on the menu. We fit the model to the data using the method of least squares. We treat these 26 menu items (which came from one restaurant) as a sample from the population of all sandwich items at all fast-food restaurants. This assumption is probably dubious. The following results were obtained from software. r2 = 0.846
S = 43.5747 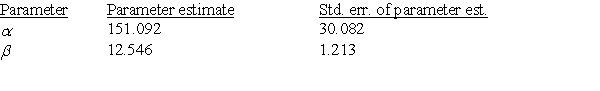 The slope of the least-squares regression line is:
A) 151.09.
B) 12.546.
C) 0.846.
D) None of the answer options is correct.
Correct Answer:

Verified
Correct Answer:
Verified
Q26: Frequent food questionnaires (FFQs) are often given
Q27: Forced expiratory volume (FEV) is the volume
Q28: Suppose we wish to predict the profits
Q29: A study of obesity risk in children
Q30: A study of obesity risk in children
Q31: Suppose we wish to predict the profits
Q33: The scatterplot below suggests a linear relationship
Q34: A study of obesity risk in children
Q35: A random sample of 19 companies from
Q36: You can visit the official website of