Multiple Choice
The scatterplot below suggests a linear relationship between the age (in years) of an antique clock and its sale price (in euros) at auction. The data are age and sale price for 11 antique clocks sold at a recent auction. We fit the least-squares regression line to the model price = + (age) , where the deviations are assumed to be independent and Normally distributed, with mean 0 and standard deviation . A summary of the output is given.
R2 = 0.848
S = 33.1559 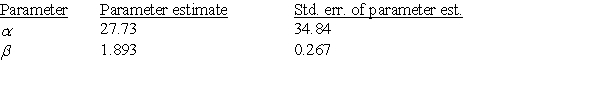 The approximate intercept of the least-squares regression line is:
A) 27.73.
B) 1.893.
C) 34.84.
D) 0.267.
Correct Answer:

Verified
Correct Answer:
Verified
Q26: Frequent food questionnaires (FFQs) are often given
Q27: Forced expiratory volume (FEV) is the volume
Q28: Suppose we wish to predict the profits
Q29: A study of obesity risk in children
Q30: A study of obesity risk in children
Q31: Suppose we wish to predict the profits
Q32: You can visit the official website of
Q34: A study of obesity risk in children
Q35: A random sample of 19 companies from
Q36: You can visit the official website of