Multiple Choice
Suppose we wish to predict the profits (in hundreds of thousands of dollars) for companies that had sales (in hundreds of thousands of dollars) of 500 units. We use statistical software to do the prediction and obtain the following output. 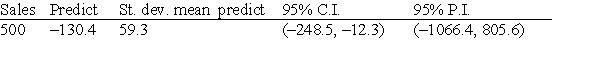 A random sample of 19 companies from the Forbes 500 list was selected, and the relationship between sales (in hundreds of thousands of dollars) and profits (in hundreds of thousands of dollars) was investigated by regression. The following simple linear regression model was used: profits = + (sales) , where the deviations were assumed to be independent and Normally distributed, with mean 0 and standard deviation . This model was fit to the data using the method of least squares. The following results were obtained from statistical software. r2 = 0.662
S = 466.2 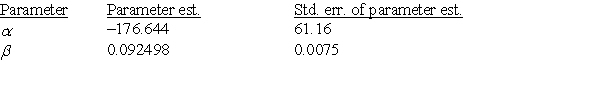 A 95% interval for this prediction is:
A) -1066.4 to 805.6.
B) -248.5 to -12.3.
C) -189.7 to -71.1.
D) 400.7 to 559.3.
Correct Answer:

Verified
Correct Answer:
Verified
Q26: Frequent food questionnaires (FFQs) are often given
Q27: Forced expiratory volume (FEV) is the volume
Q28: Suppose we wish to predict the profits
Q29: A study of obesity risk in children
Q30: A study of obesity risk in children
Q32: You can visit the official website of
Q33: The scatterplot below suggests a linear relationship
Q34: A study of obesity risk in children
Q35: A random sample of 19 companies from
Q36: You can visit the official website of