Essay
The following table shows actual sales values and forecasts provided by two different methods.
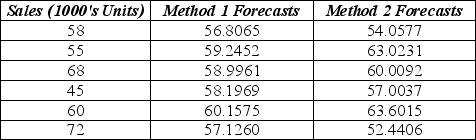 a. Calculate the MAD for each method.
b. Calculate the MSE for each method.
c. Which method forecasts better?
Correct Answer:

Verified
a. MAD (Method 1) = 7.112
MAD ...View Answer
Unlock this answer now
Get Access to more Verified Answers free of charge
Correct Answer:
Verified
MAD ...
View Answer
Unlock this answer now
Get Access to more Verified Answers free of charge
Q5: Consider the following to answer the question(s)
Q10: Consider the following to answer the question(s)
Q18: Consider the following to answer the question(s)
Q19: Consider the following to answer the question(s)
Q20: Daily closing stock prices for Kyocera Corporation
Q21: Consider the following to answer the question(s)
Q22: Consider the following to answer the question(s)
Q22: Annual estimates of the population in the
Q23: Consider the following to answer the question(s)
Q26: A large automobile parts supplier, keeps track