Multiple Choice
Consider the following to answer the question(s) below:
The quarterly sales of all types of bicycles sold at a small sporting goods store in Charlottetown for the 16 quarters from January 2005 to December 2008 are depicted in the time series graph below. 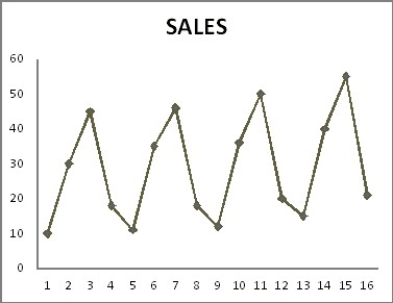

-Which of the following statements best describes this data and model?
A) The seasonal component is the most dominant.
B) All of the coefficients are significant for α = 0.05.
C) The model is additive.
D) The regression models both trend and seasonal components.
E) All of the above statements are correct.
Correct Answer:

Verified
Correct Answer:
Verified
Q5: Consider the following to answer the question(s)
Q10: Consider the following to answer the question(s)
Q18: Consider the following to answer the question(s)
Q19: Consider the following to answer the question(s)
Q20: Daily closing stock prices for Kyocera Corporation
Q21: Consider the following to answer the question(s)
Q22: Annual estimates of the population in the
Q22: Consider the following to answer the question(s)
Q26: A large automobile parts supplier, keeps track
Q27: The following table shows actual sales values