Multiple Choice
Consider the following to answer the question(s) below:
Annual estimates of the population in a certain city from 1999 (t = 1) onward are shown in the time series graph below. 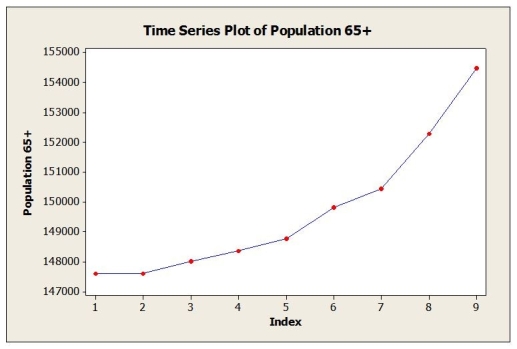
-The dominant component in this time series is
A) cyclical
B) randomness
C) seasonality
D) trend
E) No time series component is dominant.
Correct Answer:

Verified
Correct Answer:
Verified
Q5: Consider the following to answer the question(s)
Q16: Annual estimates of the population in a
Q17: Consider the following to answer the question(s)
Q18: Consider the following to answer the question(s)
Q19: Consider the following to answer the question(s)
Q20: Daily closing stock prices for Kyocera Corporation
Q22: Annual estimates of the population in the
Q22: Consider the following to answer the question(s)
Q23: Consider the following to answer the question(s)
Q26: A large automobile parts supplier, keeps track