Multiple Choice
Students in a lab measured the breaking strength S (in pounds) of wood 2 inches thick, x inches high, and 12 inches long. The results are shown in the table below. Use the regression capabilities of a graphing utility to fit a quadratic model to the data. Round the numerical values in your answer to two decimal places, where applicable. 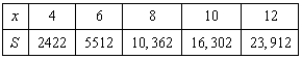
A) 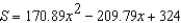
B) 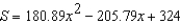
C) 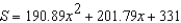
D) 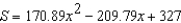
E) 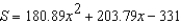
Correct Answer:

Verified
Correct Answer:
Verified
Q2: The following ordered pairs represent temperatures in
Q3: Hooke's Law states that the force F
Q4: A V8 car engine is coupled to
Q5: Each ordered pair gives the exposure index
Q6: Which function below would be most appropriate
Q7: Students in a lab measured the breaking
Q8: In an experiment, students measured the speed
Q9: A V8 car engine is coupled to
Q10: Students in a lab measured the breaking
Q11: Determine which type of function would be