Essay
The following table shows actual sales values and forecasts provided by two different methods.
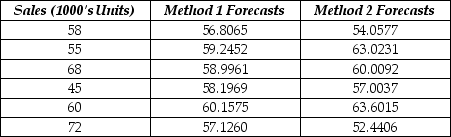 a. Calculate the MAD for each method.
b. Calculate the MSE for each method.
c. Which method forecasts better?
Correct Answer:

Verified
a. MAD (Method 1) = 7.112
MAD ...View Answer
Unlock this answer now
Get Access to more Verified Answers free of charge
Correct Answer:
Verified
MAD ...
View Answer
Unlock this answer now
Get Access to more Verified Answers free of charge
Q15: Quarterly sales data (in $10,000) for a
Q16: Consider the following to answer the question(s)
Q17: Consider the following to answer the question(s)
Q18: Consider the following to answer the question(s)
Q19: Which of the following statement is true
Q21: Consider the following to answer the question(s)
Q22: Consider the following to answer the question(s)
Q23: Consider the following to answer the question(s)
Q24: If you suspect that your trend forecasting
Q25: Annual estimates of the population in the