Essay
Quarterly sales data (in $10,000) for a small company specializing in green cleaning products are shown in the time series graph below. 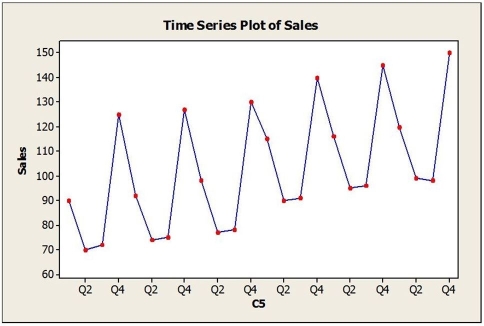 A seasonal regression model was fit to these data and the results are shown below.
The regression equation is Sales = 89.06 + 1.37t - 23.37Q2 - 23.91Q3 + 27.88Q4. 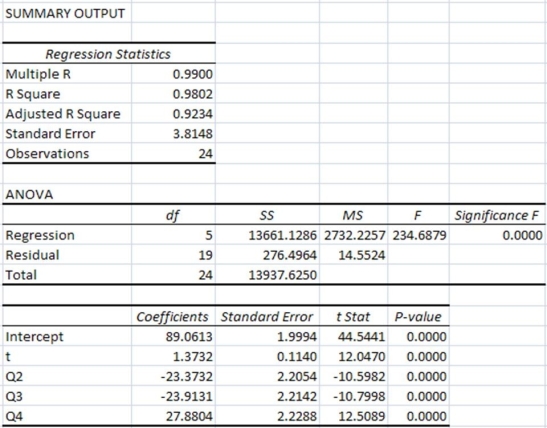 a. Is the seasonal regression model significant overall? Explain.
b. Interpret the regression coefficients in this model.
c. Use this model to provide forecasts for each of the four quarters of the next year.
Correct Answer:

Verified
a. Yes, as indicated by the F-statistic ...View Answer
Unlock this answer now
Get Access to more Verified Answers free of charge
Correct Answer:
Verified
View Answer
Unlock this answer now
Get Access to more Verified Answers free of charge
Q10: Consider the following to answer the question(s)
Q11: Monthly closing stock prices, adjusted for dividends,
Q12: Consider the following to answer the question(s)
Q13: The MSE for the forecasting method used
Q14: A large automobile parts supplier keeps track
Q16: Consider the following to answer the question(s)
Q17: Consider the following to answer the question(s)
Q18: Consider the following to answer the question(s)
Q19: Which of the following statement is true
Q20: The following table shows actual sales values