Multiple Choice
Consider the following to answer the question(s) below:
Quarterly sales data (in $10,000) for a small company specializing in green cleaning products are shown in the time series graph below. 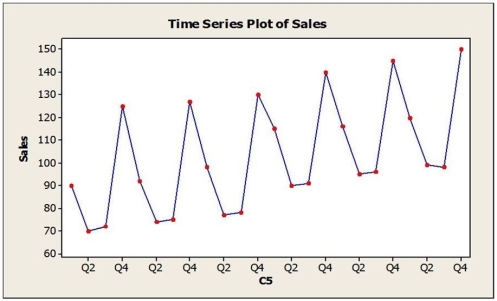 A seasonal regression model was fit to these data and the results are shown below.
The regression equation is Sales = 89.06 + 1.37t - 23.37Q2 - 23.91Q3 + 27.88Q4. 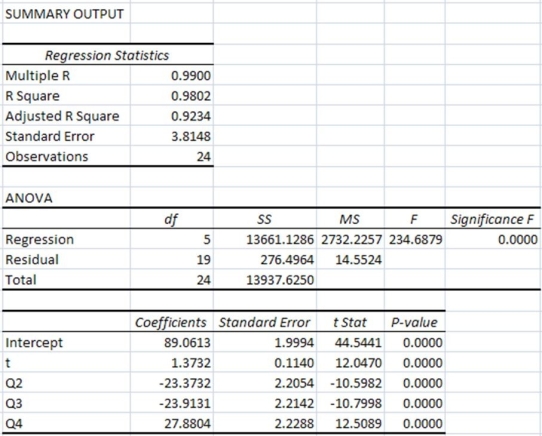
-Which of the following is not true?
A) The seasonal regression model is significant in explaining sales as indicated by the F-statistic and associated P-value.
B) The seasonal regression model explains 98.02% of the variation in sales.
C) The t-statistics and associated P-values indicate that all dummy variables representing quarters are significant.
D) Q1 is the quarter without dummy variable. The next year sales in Q1 is predicted to be $1,233,100.
E) The seasonal regression model is not significant overall as only Q1 is significant.
Correct Answer:

Verified
Correct Answer:
Verified
Q12: Consider the following to answer the question(s)
Q13: The MSE for the forecasting method used
Q14: A large automobile parts supplier keeps track
Q15: Quarterly sales data (in $10,000) for a
Q16: Consider the following to answer the question(s)
Q18: Consider the following to answer the question(s)
Q19: Which of the following statement is true
Q20: The following table shows actual sales values
Q21: Consider the following to answer the question(s)
Q22: Consider the following to answer the question(s)