Essay
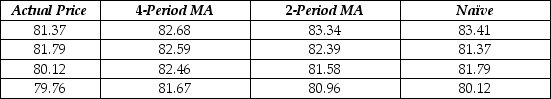
The table below shows the closing daily stock prices for Kyopera Corporation for September 2 through September 5, 2016, as well as 4-day moving average, 2-day moving average and naïve forecasts. Calculate the MAD and MSE for each of the three types of forecasts. Which is the best?
Correct Answer:

Verified
MAD (4-Period MA) = 1.59
MAD (...View Answer
Unlock this answer now
Get Access to more Verified Answers free of charge
Correct Answer:
Verified
MAD (...
View Answer
Unlock this answer now
Get Access to more Verified Answers free of charge
Q18: Consider the following to answer the question(s)
Q19: Which of the following statement is true
Q20: The following table shows actual sales values
Q21: Consider the following to answer the question(s)
Q22: Consider the following to answer the question(s)
Q23: Consider the following to answer the question(s)
Q24: If you suspect that your trend forecasting
Q25: Annual estimates of the population in the
Q27: A time series is shown below. Perform
Q28: Consider the following to answer the question(s)