Multiple Choice
Consider the following to answer the question(s) below:
Annual estimates of the population in a certain city from 2005 (t = 1) onward are shown in the time series graph below. 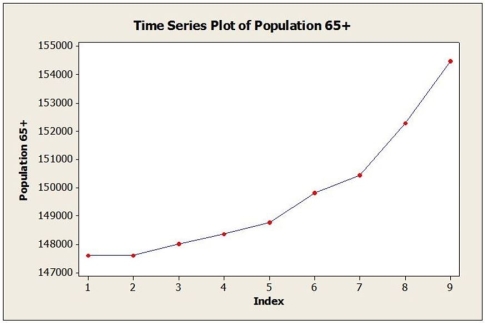
-The dominant component in this time series is
A) cyclical.
B) irregular.
C) seasonal.
D) trend.
E) No time series component is dominant. The time series is random walk.
Correct Answer:

Verified
Correct Answer:
Verified
Q18: Consider the following to answer the question(s)
Q19: Which of the following statement is true
Q20: The following table shows actual sales values
Q21: Consider the following to answer the question(s)
Q22: Consider the following to answer the question(s)
Q23: Consider the following to answer the question(s)
Q24: If you suspect that your trend forecasting
Q25: Annual estimates of the population in the
Q26: The table below shows the closing daily
Q27: A time series is shown below. Perform