Essay
The following scatterplot shows the population of Canada plotted against 5 year intervals from 1970 through 2015.
a. Based on the scatterplot, is the linear model appropriate? Explain. 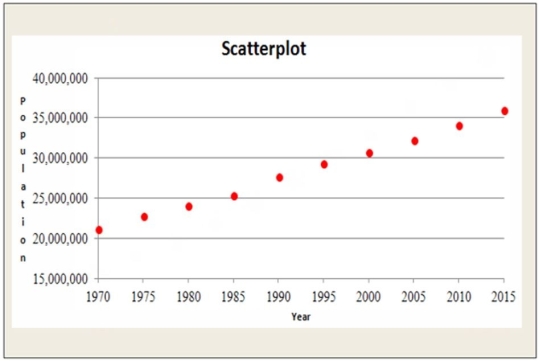 b. A linear regression model was estimated to describe the trend in the population of Canada over time. Examine the plot of Residuals against Year shown below. Is the association between Population and Year reasonably straight?
 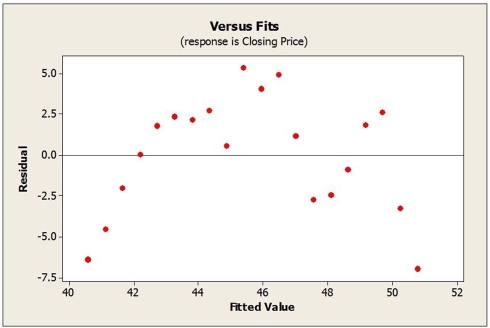 c. Would a re-expression of the data help? If so, what would you recommend?
Correct Answer:

Verified
a. The scatterplot appears straight enou...View Answer
Unlock this answer now
Get Access to more Verified Answers free of charge
Correct Answer:
Verified
View Answer
Unlock this answer now
Get Access to more Verified Answers free of charge
Q1: A regression model was developed relating average
Q2: Consider the following to answer the question(s)
Q3: Consider the following to answer the question(s)
Q4: Consider the following to answer the question(s)
Q6: Data were collected for a sample of
Q7: A food company launches an advertising campaign
Q8: Consider the following to answer the question(s)
Q9: Data on Internet usage (per 100 inhabitants)
Q10: Consider the following to answer the question(s)
Q11: Consider the following to answer the question(s)