Essay
Data were collected for a sample of companies regarding their investment in quality improvement efforts and cost savings realized as a result (both measured as a percentage of sales revenue). Below is the scatterplot. 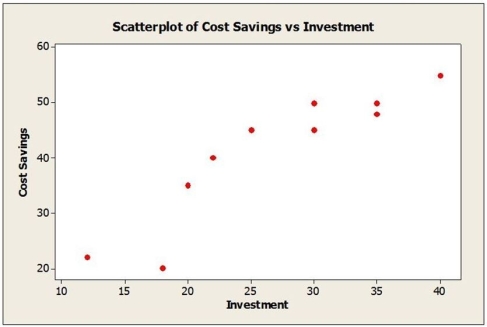 The correlation coefficient for these data is r = 0.913. If data were collected for individual departments within companies rather than at the company level, would you expect the correlation to be weaker, stronger or about the same? Explain.
Correct Answer:

Verified
Relationships based on averages have hig...View Answer
Unlock this answer now
Get Access to more Verified Answers free of charge
Correct Answer:
Verified
View Answer
Unlock this answer now
Get Access to more Verified Answers free of charge
Q1: A regression model was developed relating average
Q2: Consider the following to answer the question(s)
Q3: Consider the following to answer the question(s)
Q4: Consider the following to answer the question(s)
Q5: The following scatterplot shows the population of
Q7: A food company launches an advertising campaign
Q8: Consider the following to answer the question(s)
Q9: Data on Internet usage (per 100 inhabitants)
Q10: Consider the following to answer the question(s)
Q11: Consider the following to answer the question(s)