Essay
A regression model was developed relating average annual pay to the percentage of women employed for a sample of companies. Below is the plot of residuals versus predicted values. 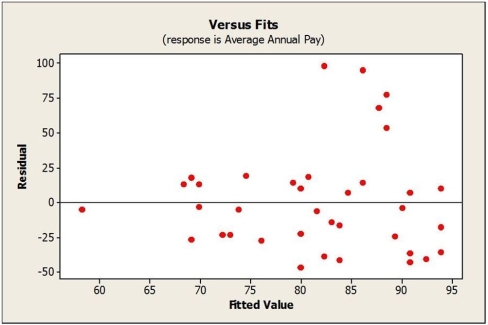 a. What can you see in the plot of residuals that may not have been clear in the original scatterplot of the data?
b. Would a re-expression of the data help? If so, what would you recommend?
Correct Answer:

Verified
Correct Answer:
Verified
Q2: Consider the following to answer the question(s)
Q3: Consider the following to answer the question(s)
Q4: Consider the following to answer the question(s)
Q5: The following scatterplot shows the population of
Q6: Data were collected for a sample of
Q7: A food company launches an advertising campaign
Q8: Consider the following to answer the question(s)
Q9: Data on Internet usage (per 100 inhabitants)
Q10: Consider the following to answer the question(s)
Q11: Consider the following to answer the question(s)