Multiple Choice
Consider the table showing the numbers of infants born to each of five generations in a certain family. Change the data so that they represent the generation and natural log of the infants. Use the method of least squares to find the best fitting linear model for the changed data where x represents the generation. You should keep the data in the form  and should not round the values until the final calculation. Give your coefficients to four decimal places.
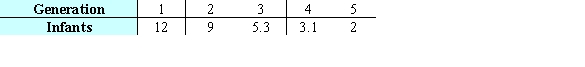
A) 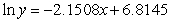
B) 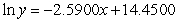
C) 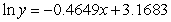
D) 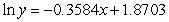
E) 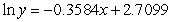
Correct Answer:

Verified
Correct Answer:
Verified
Q11: A small percent of homes in an
Q12: Suppose that <img src="https://d2lvgg3v3hfg70.cloudfront.net/TB6775/.jpg" alt="Suppose that
Q13: A factory makes 7-mm aluminum ball bearings.
Q14: A manufacture is designing a packaging carton
Q15: Consider the contour graph and the three-dimensional
Q17: Let <img src="https://d2lvgg3v3hfg70.cloudfront.net/TB6775/.jpg" alt="Let be
Q18: Locate the optimal point of the constrained
Q19: A process to extract pigment from sunflower
Q20: A company has the Cobb-Douglas production function
Q21: Consider the following contour graph and three-dimensional