Multiple Choice
A small percent of homes in an region lack certain amenities. The data is given in the table below. Give the linear model of the best fitting line  , where x is the number of years since 1984.
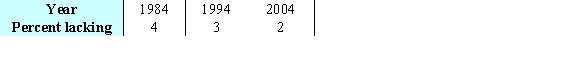
A) 
B) 
C) 
D) 
E) 
Correct Answer:

Verified
Correct Answer:
Verified
Q6: The table below gives the number of
Q7: Suppose the table shows the average price
Q8: Before technology was available to fit many
Q9: The figures show a contour graph for
Q10: A travel agency offers spring-break cruise packages.
Q12: Suppose that <img src="https://d2lvgg3v3hfg70.cloudfront.net/TB6775/.jpg" alt="Suppose that
Q13: A factory makes 7-mm aluminum ball bearings.
Q14: A manufacture is designing a packaging carton
Q15: Consider the contour graph and the three-dimensional
Q16: Consider the table showing the numbers of