Multiple Choice
Consider the graph of r(t) , the rate of change in the price of a technology stock, during the first 55 days of trading of 2003. Using the information present below, find the graph of the accumulation function starting at day 16. 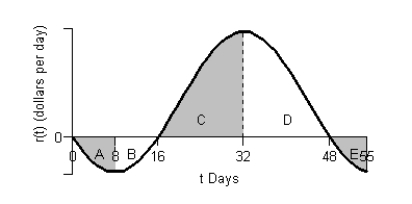

A) 
B) 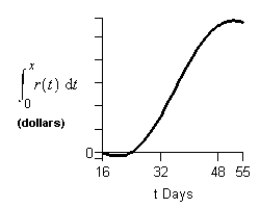
C) 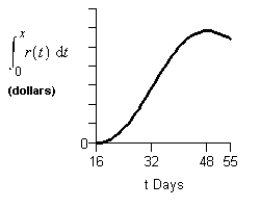
D) 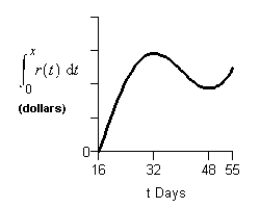
E) 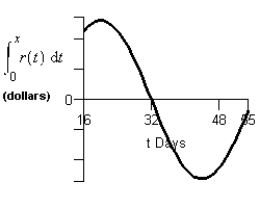
Correct Answer:

Verified
Correct Answer:
Verified
Q1: Evaluate the integral below. Use a graphing
Q2: Blood pressure varies for individuals throughout the
Q3: The acceleration of a race car during
Q5: If possible, find the general antiderivative of
Q6: Find <img src="https://d2lvgg3v3hfg70.cloudfront.net/TB6775/.jpg" alt="Find .
Q7: The federal government standard says that carbon
Q8: Evaluate the integral <img src="https://d2lvgg3v3hfg70.cloudfront.net/TB6775/.jpg" alt="Evaluate the
Q9: A program to protect a species of
Q10: The graph of <img src="https://d2lvgg3v3hfg70.cloudfront.net/TB6775/.jpg" alt="The graph
Q11: Scientists can model the change in snow