Multiple Choice
The graph of  represents the rate of change of rainfall during a severe thunderstorm t hours after rainfall began. Draw a graph of the total amount of rain that fell during this storm, using the following facts:
  The rainfall started at 2 P.M. and did not stop until 8 P.M.
  2 inches of rain fell between 2 P.M. and 5 P.M.
  The total amount of rain that fell during the storm was 5.2 inches.
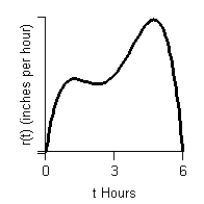
A) 
B) 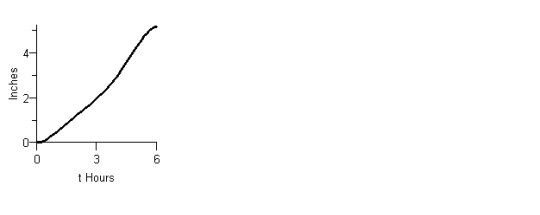
C) 
D) 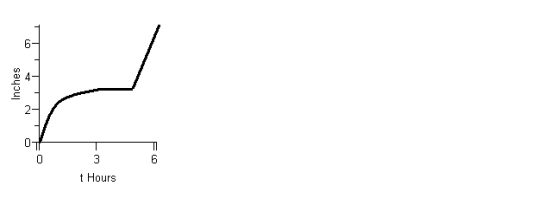
E) 
Correct Answer:

Verified
Correct Answer:
Verified
Q5: If possible, find the general antiderivative of
Q6: Find <img src="https://d2lvgg3v3hfg70.cloudfront.net/TB6775/.jpg" alt="Find .
Q7: The federal government standard says that carbon
Q8: Evaluate the integral <img src="https://d2lvgg3v3hfg70.cloudfront.net/TB6775/.jpg" alt="Evaluate the
Q9: A program to protect a species of
Q11: Scientists can model the change in snow
Q12: The rate of change of the weight
Q13: Find the specific antiderivative of <img src="https://d2lvgg3v3hfg70.cloudfront.net/TB6775/.jpg"
Q14: Consider the graph of f(t). <img src="https://d2lvgg3v3hfg70.cloudfront.net/TB6775/.jpg"
Q15: Consider the graph of r(t), the rate