Multiple Choice
Scientists can model the change in snow depth per day. The graph below shows a model using equivalent centimeters of water per day form April 1 to June 9. Estimate, to the nearest centimeter, the area of the region beneath the curve from May 12 (day 42) to June 9 (day 70) . Interpret your answer. 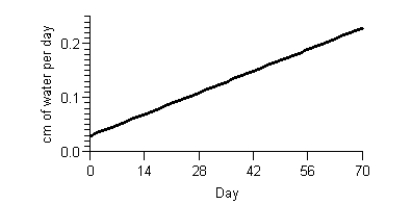
A) Between May 12 (day 42) and June 9 (day 70) , there was snowfall equivalent to approximately 3 centimeters of water.
B) Between May 12 (day 42) and June 9 (day 70) , there was snowfall equivalent to approximately 5 centimeters of water.
C) Between May 12 (day 42) and June 9 (day 70) , each day there was snowfall equivalent to approximately 5 centimeters of water.
D) Between May 12 (day 42) and June 9 (day 70) , each day there was snowfall equivalent to approximately 3 centimeters of water.
E) Between May 12 (day 42) and June 9 (day 70) , there was snowfall equivalent to approximately 2 centimeters of water.
Correct Answer:

Verified
Correct Answer:
Verified
Q6: Find <img src="https://d2lvgg3v3hfg70.cloudfront.net/TB6775/.jpg" alt="Find .
Q7: The federal government standard says that carbon
Q8: Evaluate the integral <img src="https://d2lvgg3v3hfg70.cloudfront.net/TB6775/.jpg" alt="Evaluate the
Q9: A program to protect a species of
Q10: The graph of <img src="https://d2lvgg3v3hfg70.cloudfront.net/TB6775/.jpg" alt="The graph
Q12: The rate of change of the weight
Q13: Find the specific antiderivative of <img src="https://d2lvgg3v3hfg70.cloudfront.net/TB6775/.jpg"
Q14: Consider the graph of f(t). <img src="https://d2lvgg3v3hfg70.cloudfront.net/TB6775/.jpg"
Q15: Consider the graph of r(t), the rate
Q16: The acceleration of a race car during