Essay
Given the graph below, use 5 rectangles to estimate the area under the graph from x = 0 to x = 5. Compute L5 (sample points are left endpoints), R5 (sample points are right endpoints) and M5 (sample points are midpoints). Which of the estimates appears to give the best estimate? Justify your answer. 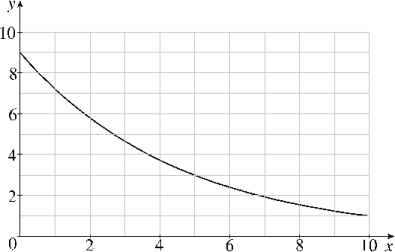
Correct Answer:

Verified
Correct Answer:
Verified
Related Questions
Q1: Find the partial fraction expansion of
Q2: Let f (x) = <span
Q4: Let <span class="ql-formula" data-value="f (
Q5: Evaluate <span class="ql-formula" data-value="\int _
Q6: Find the value of the integral
Q7: What is the value of the
Q8: Given the graph of <span
Q9: Prove that <span class="ql-formula" data-value="\frac
Q10: Evaluate the improper integral <span
Q11: A particle travels along a line.