Multiple Choice
Given the graph of y = f (x) below, select a graph which best represents the graph of 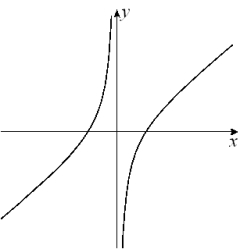
A) 
B) 
C) 
D) 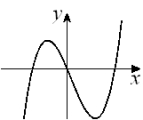
E) 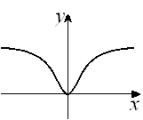
F) 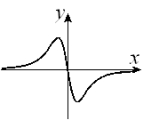
G) 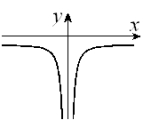
H) 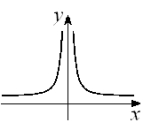
Correct Answer:

Verified
Correct Answer:
Verified
Related Questions
Q40: At what value(s) of x does
Q41: Given the following information about limits,
Q42: Sketch the graph of a function
Q43: The graph of f is given below.
Q44: Find the value of the limit
Q46: Use the graphs of f and
Q47: Determine whether each function is continuous or
Q48: Given the graph of <span
Q49: Determine <span class="ql-formula" data-value="\lim _
Q50: A projectile is launched vertically upward