Short Answer
The diagram in Figure shows a pathogen (in red) that is present in different cellular compartments of each of the cell types shown. In each case, a specific T cell subset will recognize peptides of that pathogen presented on MHC molecules on the surface of the cell, and will execute its effector function. From the list below, match the appropriate T cell effector response to the cell type and location of the pathogen. 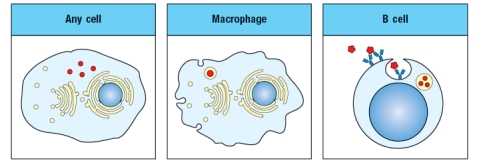
i. CD4 T cell killing of target cell
ii. CD8 T cell killing of target cell
iii. CD4 T cell activation of target cell's antibody production
iv. CD8 T cell activation of target cell's antibody production
v. CD4 T cell activation of target cell's ability to kill intracellular pathogen
vi. CD8 T cell activation of target cell's ability to kill intracellular pathogen
Correct Answer:

Verified
A = ii
B = v
C = iii
Viruses and some ba...View Answer
Unlock this answer now
Get Access to more Verified Answers free of charge
Correct Answer:
Verified
B = v
C = iii
Viruses and some ba...
View Answer
Unlock this answer now
Get Access to more Verified Answers free of charge
Q20: Three major cell types, dendritic cells, macrophages,
Q21: The adaptive immune system uses multiple strategies
Q22: Several types of pathogens encode proteins that
Q23: The extensive polymorphism of MHC genes in
Q24: Alloreactivity refers to the ability of T
Q25: MHC polymorphism at individual MHC genes appears
Q26: The MHC locus encodes a large number
Q27: In the 1980s, a mutant strain
Q28: Multiple mechanisms contribute to create a wide
Q29: The MARCH-1 E3-ubiquitin ligase is expressed in