Related Questions
Q30: Given the following frequency distribution, how many
Q31: Greg wants to construct a frequency distribution
Q33: How many values are in the data
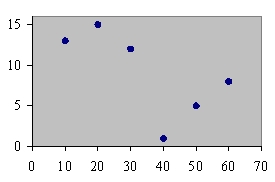
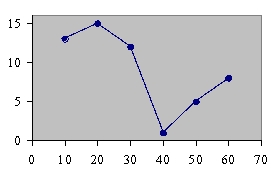
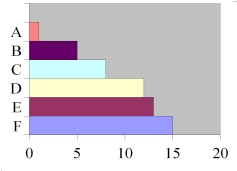
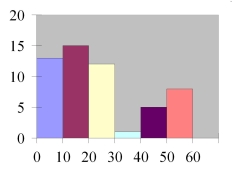
Q36: What type of graph is the figure
Q37: What is the lower class limit in
Q37: Given the following two sets of data,
Q40: The percentages of white, wheat, and rye
Q54: The cumulative frequency for a class is
Q73: A pie graph would best represent the
Q104: If the graph of a frequency distribution


