Multiple Choice
How many values are in the data set whose histogram is shown below ? 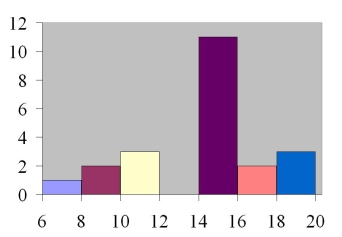
A) 6
B) 22
C) 76
D) 72
Correct Answer:

Verified
Correct Answer:
Verified
Related Questions
Q28: If a frequency distribution had class boundaries
Q29: Which type of graph represents the data
Q30: Given the following frequency distribution, how many
Q31: Greg wants to construct a frequency distribution
Q35: Which of the following is a histogram?<br>A)
Q36: What type of graph is the figure
Q37: What is the lower class limit in
Q54: The cumulative frequency for a class is
Q73: A pie graph would best represent the
Q104: If the graph of a frequency distribution