Multiple Choice
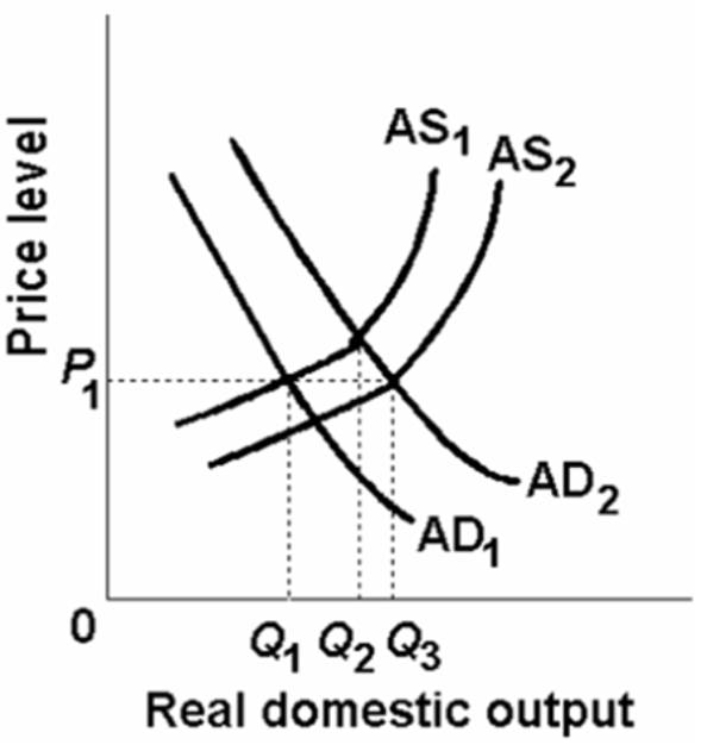
-In the above figure AD1 and AS1 represent the original aggregate supply and demand curves and AD2 and AS2 show the new aggregate demand and supply curves.The changes in aggregate demand and supply in the above diagram produce:
A) a higher price level.
B) an expansion of real output and a stable price level.
C) an expansion of real output and a higher price level.
D) a decline in real output and a stable price level.
Correct Answer:

Verified
Correct Answer:
Verified
Q6: Would increased downward price flexibility lead to
Q108: An increase in the price level, other
Q115: A decrease in aggregate demand is most
Q137: Productivity measures<br>A) real output per unit of
Q144: Other things being equal, if the national
Q145: The following table is for a particular
Q146: <img src="https://d2lvgg3v3hfg70.cloudfront.net/TB2474/.jpg" alt=" -In the above
Q152: In the below diagram assume that the
Q157: How can the aggregate demand curve be
Q164: A movement upward along an existing aggregate