Multiple Choice
Exhibit 13.1
The following questions are based on the output below.
A store currently operates its service system with 1 operator. Arrivals follow a Poisson distribution and service times are exponentially distributed. The following spreadsheet has been developed for the system. 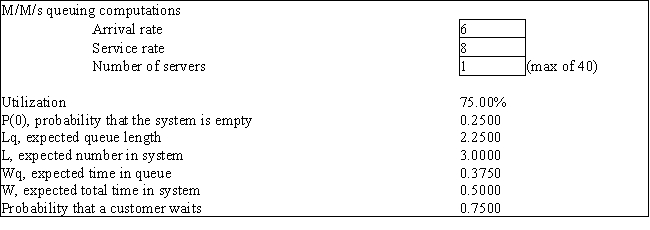
-Refer to Exhibit 13.1. What is the average amount of time spent waiting in line?
A) 0.375
B) 0.50
C) 2.25
D) 3.00
Correct Answer:

Verified
Correct Answer:
Verified
Q64: Exhibit 13.7<br>The following questions refer to the
Q65: Exhibit 12.5<br>The following questions use the information
Q66: Exhibit 12.5<br>The following questions use the information
Q67: Exhibit 13.2<br>The following questions refer to the
Q68: Exhibit 13.1<br>The following questions are based on
Q70: Exhibit 12.5<br>The following questions use the information
Q71: Exhibit 13.1<br>The following questions are based on
Q72: Exhibit 12.5<br>The following questions use the information
Q73: Exhibit 13.1<br>The following questions are based on
Q74: Exhibit 12.5<br>The following questions use the information