Short Answer
Exhibit 13.6
The following questions refer to the information and output below.
The university computer lab has 10 computers which are constantly being used by students. Users need help from the one lab assistant fairly often. Students ask for help at a Poisson rate of with an average of 4 requests per hour for any one computer. The assistant answers questions as quickly as possible and the service time follows an exponential distribution with mean of 1 minute per help session. The following queuing analysis spreadsheet was developed from this information. 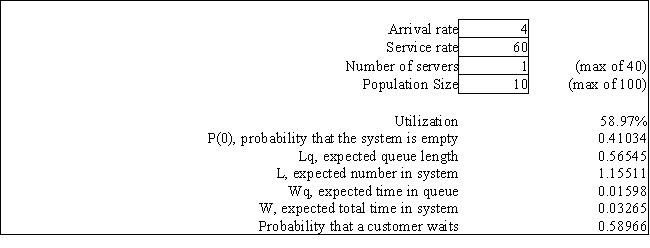
-Refer to Exhibit 13.6. What is the Kendall notation for this system?
Correct Answer:

Verified
M/M/1 with...View Answer
Unlock this answer now
Get Access to more Verified Answers free of charge
Correct Answer:
Verified
View Answer
Unlock this answer now
Get Access to more Verified Answers free of charge
Q23: A grocery clerk can serve 20 customers
Q24: Exhibit 13.1<br>The following questions are based on
Q25: Exhibit 13.1<br>The following questions are based on
Q26: Exhibit 12.5<br>The following questions use the information
Q27: Exhibit 13.1<br>The following questions are based on
Q29: Exhibit 12.5<br>The following questions use the information
Q30: Exhibit 13.1<br>The following questions are based on
Q31: Exhibit 13.2<br>The following questions refer to the
Q32: Exhibit 13.1<br>The following questions are based on
Q33: Exhibit 13.3<br>The following questions refer to the