Multiple Choice
The figure below shows revenue and cost curves of a natural monopoly firm. Figure 26.1 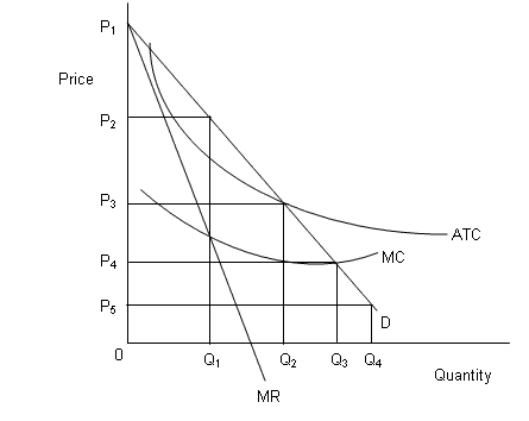 In the figure,
D: Demand curve
MR: Marginal revenue curve
MC: Marginal cost curve
ATC: Average total cost curve
Refer to Figure 26.1.Identify the fair-rate-of-return price.
A) P5
B) P2
C) P4
D) P1
E) P3
Correct Answer:

Verified
Correct Answer:
Verified
Q1: <img src="https://d2lvgg3v3hfg70.cloudfront.net/TB1748/.jpg" alt=" -The judicial doctrine,
Q3: The figure below shows revenue and cost
Q10: The figure below shows revenue and cost
Q13: If social regulation increases a firm's fixed
Q29: In the following figure, the first panel
Q42: In the following figure, the first panel
Q63: In the following figure, the first panel
Q77: In the following figure, the first panel
Q80: In the following figure, the first panel
Q86: The argument made in favor of privatization