Multiple Choice
In the following figure, the first panel shows a market situation prior to regulation and the second panel shows the effects of regulation. Figure 26.2 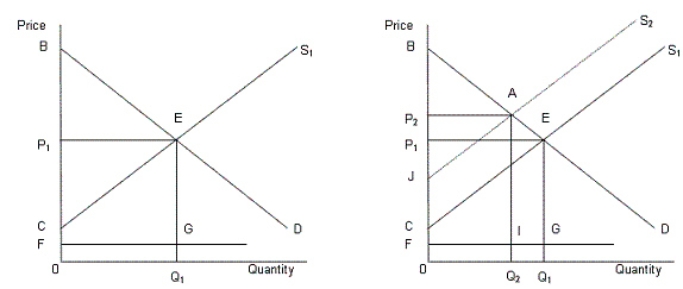 In the figure,
D: Demand curve for automobiles
S1: Supply curve of automobiles prior to regulation
S2: Supply curve of automobiles after regulation
FG: Clean up cost per unit
What is the total societal surplus prior to regulation described in Figure 26.2?
A) Area 0FGQ1.
B) Area BEP1.
C) Area CEP1.
D) Area FGEP1.
E) Area BEC.
Correct Answer:

Verified
Correct Answer:
Verified
Q1: <img src="https://d2lvgg3v3hfg70.cloudfront.net/TB1748/.jpg" alt=" -The judicial doctrine,
Q3: The figure below shows revenue and cost
Q10: The figure below shows revenue and cost
Q12: In the following figure, the first panel
Q13: If social regulation increases a firm's fixed
Q29: In the following figure, the first panel
Q35: In the following figure, the first panel
Q44: The figure below shows revenue and cost
Q63: In the following figure, the first panel
Q80: In the following figure, the first panel