Multiple Choice
The figure given below depicts the equilibrium exchange rate between the U.S dollar and the Mexican peso. Figure 13.2 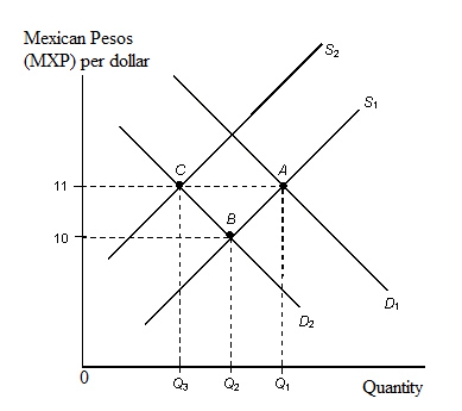 Refer to Figure 13.2.When the Mexican demand for U.S.dollars rises from D2 to D1 and the relevant supply curve is S1:
A) the U.S.dollar depreciates in value relative to the peso.
B) the Mexican peso depreciates in value relative to the U.S.dollar.
C) the Mexican peso appreciates in value relative to the U.S.dollar
D) U.S.imports from Mexico decreases.
E) Mexican net exports to the United States becomes positive.
Correct Answer:

Verified
Correct Answer:
Verified
Q129: The buying and selling of government bonds
Q130: Table 13.1 <img src="https://d2lvgg3v3hfg70.cloudfront.net/TB2060/.jpg" alt="Table 13.1
Q131: In the figure given below panel A
Q132: The figure given below depicts the equilibrium
Q133: If the FOMC purchases government bonds priced
Q135: The sale of U.S.currency and purchase of
Q136: Suppose you hold $5, 000 in cash
Q137: If a bond pays a fixed return
Q138: If a depreciation of the British pound
Q139: As the velocity of money rises, the