Multiple Choice
The figure given below depicts the equilibrium exchange rate between the U.S dollar and the Mexican peso. Figure 13.2 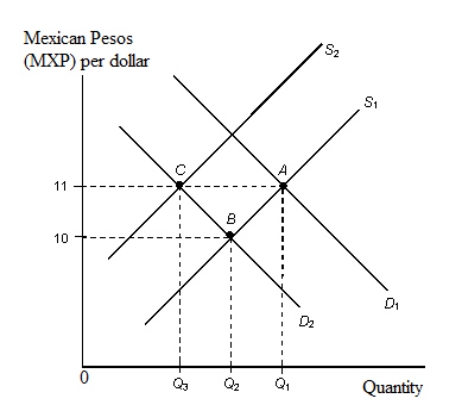 Refer to Figure 13.2.Given a target exchange rate of MXP 11 = $1 with S1 the relevant supply curve and a decline in Mexican demand for U.S.dollars from D1 to D2 the Fed intervenes in the foreign exchange market by:
A) selling Q3 amount of pesos.
B) selling Q3 amount of U.S.dollars.
C) buying (Q2 - Q1) amount of pesos.
D) buying (Q1 - Q3) amount of U.S.dollars.
E) buying (Q2 - Q3) amount of U.S dollars.
Correct Answer:

Verified
Correct Answer:
Verified
Q127: The FOMC carries out its policies through
Q128: The use of domestic open market operations
Q129: The buying and selling of government bonds
Q130: Table 13.1 <img src="https://d2lvgg3v3hfg70.cloudfront.net/TB2060/.jpg" alt="Table 13.1
Q131: In the figure given below panel A
Q133: If the FOMC purchases government bonds priced
Q134: The figure given below depicts the equilibrium
Q135: The sale of U.S.currency and purchase of
Q136: Suppose you hold $5, 000 in cash
Q137: If a bond pays a fixed return