Multiple Choice
In the figure given below panel A represents money market equilibrium, panel B represents investment demand, and panel C represents equilibrium real GDP. Figure 13.3 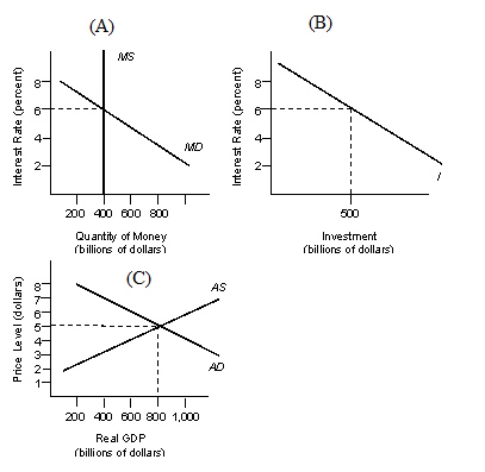 Refer to Figure 13.3.Other things equal, if real GDP is equal to $900 billion, then:
A) the money demand curve will be to the left of the one shown in the figure above.
B) the quantity of money demanded will be less than $400 billion and can be illustrated by a downward movement along the money demand curve.
C) the quantity of money demanded will be greater than $400 billion and can be illustrated by an upward movement along the money demand curve.
D) the investment demand curve will be to the left of the one illustrated in Panel (A) of the figure.
E) the money demand curve will be to the right of the one illustrated in Panel (A) of the figure.
Correct Answer:

Verified
Correct Answer:
Verified
Q126: Table 13.1 <img src="https://d2lvgg3v3hfg70.cloudfront.net/TB2060/.jpg" alt="Table 13.1
Q127: The FOMC carries out its policies through
Q128: The use of domestic open market operations
Q129: The buying and selling of government bonds
Q130: Table 13.1 <img src="https://d2lvgg3v3hfg70.cloudfront.net/TB2060/.jpg" alt="Table 13.1
Q132: The figure given below depicts the equilibrium
Q133: If the FOMC purchases government bonds priced
Q134: The figure given below depicts the equilibrium
Q135: The sale of U.S.currency and purchase of
Q136: Suppose you hold $5, 000 in cash