Multiple Choice
Imagine we were interested in the effect of supporters singing on the number of goals scored by soccer teams. We took 10 groups of supporters of 10 different soccer teams and asked them to attend three home games, one at which they were instructed to sing in support of their team (e.g., ‘Come on, you Reds!’) , one at which they were instructed to sing negative songs towards the opposition (e.g., ‘You’re getting sacked in the morning!’) and one at which they were instructed to sit quietly. The order of chanting was counterbalanced across groups.
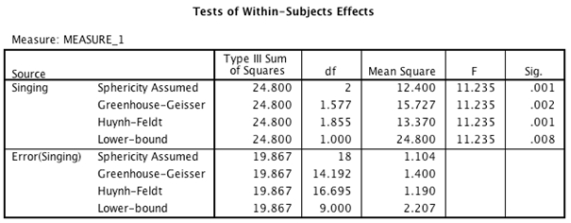
- An ANOVA with a simple contrasts using the last category as a reference was conducted. Looking at the output tables below, what does the first contrast (Level 1 vs. Level 3) compare?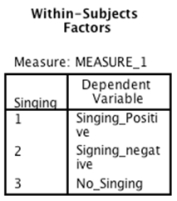
 Tests of Within-Subjects Contrasts
Measure: MEASURE_1
A) Positive singing vs.no singing
B) No singing vs.negative singing
C) Negative singing vs.positive singing
D) We cannot tell which groups the levels represent from this output.
Correct Answer:

Verified
Correct Answer:
Verified
Q1: Imagine we were interested in the
Q3: When entering data for a repeated-measures design
Q4: An educational researcher wanted to test the
Q5: Which of the following is a means
Q6: What is the consequence of violating the
Q7: When an experimental manipulation is carried out
Q8: Which of these are potential sources of
Q9: What is Repeated-measures factorial design?<br>A)An experiment, which
Q10: Imagine we were interested in the
Q11: Departures from sphericity can be measured using:<br>A)Neither