Multiple Choice
We took a sample of children who had been learning to play a musical instrument for five years. We measured the number of hours they spent practising each week and assessed their musical skill by how many of 8 increasingly difficult exams they had passed. We also asked them whether their parents forced them to practise or not (were their parents pushy?) . What does the graph suggest about children who spend approximately 1 hour practising a week? 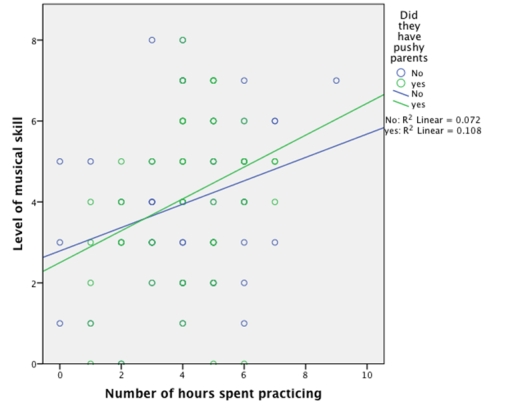
A) They were less affected by having a pushy parent than those that practised for 7 hours.
B) They had less variability in their ability than those who didn't practise at all.
C) On average, these children will be more musically skilled if they do not have pushy parents than if they do have pushy parents.
D) On average, these children will be more musically skilled if they have pushy parents than if they do not have pushy parents.
Correct Answer:

Verified
Correct Answer:
Verified
Q8: We took a sample of children who
Q9: What can we say about the graph
Q10: In IBM SPSS, what is this graph
Q11: Looking at the graph below, approximately what
Q12: What is the graph below known as?
Q14: What is the graph below known as?
Q15: A study was done to investigate the
Q16: The graph below shows the mean success
Q17: In IBM SPSS, the following graph is
Q18: Looking at the graph below, which of