Multiple Choice
The graph below shows the mean success rate of cutting down on smoking (positive score = success) in people who wanted to quit and people who did not want to quit. Which of the following statements is the most true? 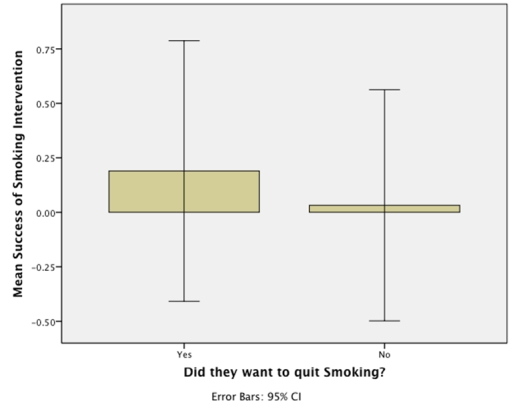
A) On average, people who wanted to quit were 25 times more successful than those who did not.
B) On average, success was six times higher in people who wanted to quit than in those who did not.
C) The average success was significantly higher in people who wanted to quit.
D) The effect in the population is likely to be the same for those who did and did not want to quit.
Correct Answer:

Verified
Correct Answer:
Verified
Q11: Looking at the graph below, approximately what
Q12: What is the graph below known as?
Q13: We took a sample of children who
Q14: What is the graph below known as?
Q15: A study was done to investigate the
Q17: In IBM SPSS, the following graph is
Q18: Looking at the graph below, which of
Q19: Approximately what is the mean success score
Q20: Imagine we took a group of smokers,
Q21: Based on the chart, what was the