Multiple Choice
Looking at the graph below, which of the following statements are correct? 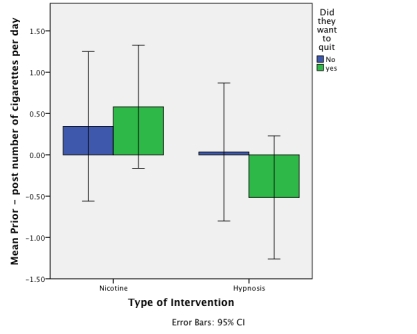
A) On average, for those who wanted to quit smoking, the nicotine patches reduced the number of cigarettes smoked per day, whereas hypnosis actually increased the number of cigarettes smoked per day.
B) On average, the nicotine intervention was more successful in those who wanted to quit smoking than in those who did not want to quit, whereas the hypnosis intervention was more successful in those who did not want to quit smoking than in those who did.
C) All of the statements are correct.
D) Overall, the nicotine intervention was the most successful at reducing the number of cigarettes smoked per day.
Correct Answer:

Verified
Correct Answer:
Verified
Q13: We took a sample of children who
Q14: What is the graph below known as?
Q15: A study was done to investigate the
Q16: The graph below shows the mean success
Q17: In IBM SPSS, the following graph is
Q19: Approximately what is the mean success score
Q20: Imagine we took a group of smokers,
Q21: Based on the chart, what was the
Q22: Looking at the graph below, which intervention
Q23: What does a histogram show?<br>A)A histogram is