Multiple Choice
Figure 8-21 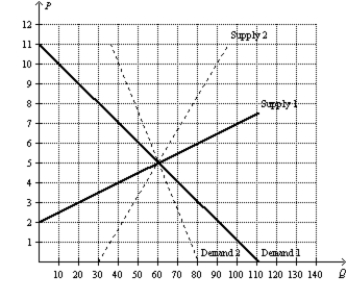
-Refer to Figure 8-21.Suppose the government places a $3 per-unit tax on this good.The smallest deadweight loss from the tax would occur in a market where demand is represented by
A) Demand 1,and supply is represented by Supply 1.
B) Demand 1,and supply is represented by Supply 2.
C) Demand 2,and supply is represented by Supply 1.
D) Demand 2,and supply is represented by Supply 2.
Correct Answer:

Verified
Correct Answer:
Verified
Q17: Figure 8-23.The figure represents the relationship between
Q19: Which of the following events always would
Q20: Figure 8-19<br>The vertical distance between points A
Q21: Figure 8-23.The figure represents the relationship between
Q23: A decrease in the size of a
Q24: Suppose that the market for large,64-ounce soft
Q25: The higher a country's tax rates,the more
Q26: Figure 8-20<br>On the vertical axis of each
Q27: The graph that represents the amount of
Q130: Suppose the federal government doubles the gasoline