Multiple Choice
Figure 8-23.The figure represents the relationship between the size of a tax and the tax revenue raised by that tax. 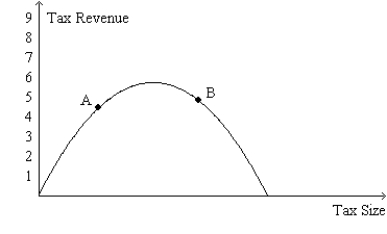
-Refer to Figure 8-23.If the economy is at point A on the curve,then a small increase in the tax rate will
A) increase the deadweight loss of the tax and increase tax revenue.
B) increase the deadweight loss of the tax and decrease tax revenue.
C) decrease the deadweight loss of the tax and increase tax revenue.
D) decrease the deadweight loss of the tax and decrease tax revenue.
Correct Answer:

Verified
Correct Answer:
Verified
Q16: Suppose the tax on automobile tires is
Q17: Figure 8-23.The figure represents the relationship between
Q19: Which of the following events always would
Q20: Figure 8-19<br>The vertical distance between points A
Q22: Figure 8-21 <img src="https://d2lvgg3v3hfg70.cloudfront.net/TB2297/.jpg" alt="Figure 8-21
Q23: A decrease in the size of a
Q24: Suppose that the market for large,64-ounce soft
Q25: The higher a country's tax rates,the more
Q26: Figure 8-20<br>On the vertical axis of each
Q130: Suppose the federal government doubles the gasoline