Multiple Choice
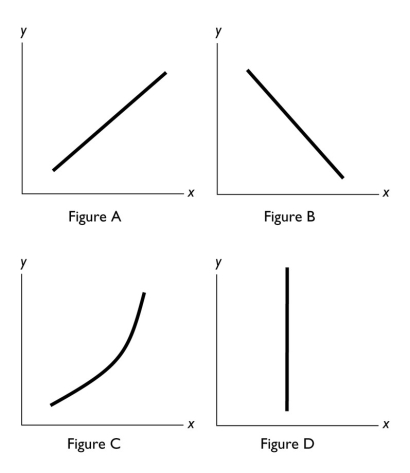
-In the diagram above,which figure(s) show(s) no relationship between the variables?
A) both B and C
B) only B
C) both A and C
D) only D
E) both A and B
Correct Answer:

Verified
Correct Answer:
Verified
Q106: <img src="https://d2lvgg3v3hfg70.cloudfront.net/TB8586/.jpg" alt=" -The figure above
Q318: <img src="https://d2lvgg3v3hfg70.cloudfront.net/TB1458/.jpg" alt=" -A graph shows
Q319: The slope of a line equals the
Q320: You have data for the amount of
Q321: In the diagram below,label the x-axis,the y-axis,and
Q322: <img src="https://d2lvgg3v3hfg70.cloudfront.net/TB1458/.jpg" alt=" -The table above
Q324: A normative statement<br>i.can be tested as to
Q325: In New State,the bottling law requires that
Q327: <img src="https://d2lvgg3v3hfg70.cloudfront.net/TB1458/.jpg" alt=" -A graph shows
Q328: A graph that shows how the amount