Essay
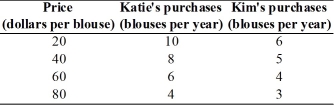
-The table above shows how many blouses Katie and Kim will purchase at different prices for a blouse.In the figure,label the axes and put the price on the y-axis and the quantity of blouses on the x-axis.Plot the data for Katie in the figure.Then,plot the data for Kim in the figure.
Correct Answer:

Verified
 The figure above shows the la...
View Answer
Unlock this answer now
Get Access to more Verified Answers free of charge
Correct Answer:
Verified
View Answer
Unlock this answer now
Get Access to more Verified Answers free of charge
Q106: <img src="https://d2lvgg3v3hfg70.cloudfront.net/TB8586/.jpg" alt=" -The figure above
Q317: Demonstrating how an economic variable changes from
Q318: <img src="https://d2lvgg3v3hfg70.cloudfront.net/TB1458/.jpg" alt=" -A graph shows
Q319: The slope of a line equals the
Q320: You have data for the amount of
Q321: In the diagram below,label the x-axis,the y-axis,and
Q323: <img src="https://d2lvgg3v3hfg70.cloudfront.net/TB1458/.jpg" alt=" -In the diagram
Q324: A normative statement<br>i.can be tested as to
Q325: In New State,the bottling law requires that
Q327: <img src="https://d2lvgg3v3hfg70.cloudfront.net/TB1458/.jpg" alt=" -A graph shows