Multiple Choice
The following table shows the annual revenues (in millions of dollars) of a pharmaceutical company over the period 1990-2011. 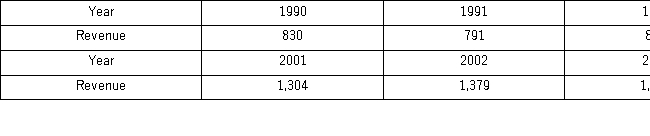
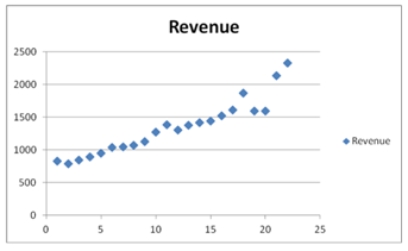 The Excel scatterplot shown indicates that the annual revenues have an increasing trend.Therefore,linear,exponential,quadratic,and cubic models were used to fit the trend,and the following relevant information became available after applying linear regression.
 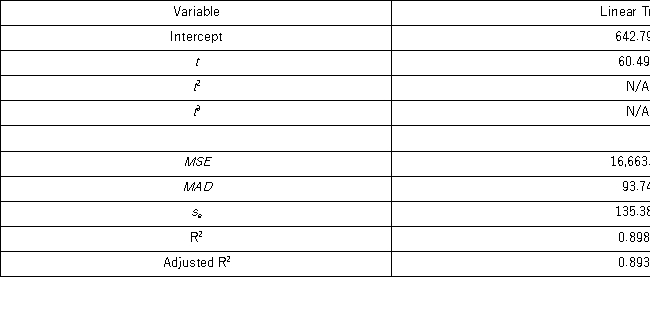 Which of the following is an exponential trend equation?
A)  = exp(6.632 + 0.045t + (0.069) 2⁄2)
B)  = 6.632 + 0.045t + 0.069⁄2
C)  = exp(6.632 + 0.045t + 0.069⁄2)
D) 
Correct Answer:

Verified
Correct Answer:
Verified
Q18: Ideally, the chosen model is best in
Q47: Based on quarterly data collected over the
Q49: The following table includes the information about
Q50: The following table includes the information about
Q50: The optimal value of the speed of
Q51: Quarterly sales of a department store for
Q54: Quarterly sales of a department store for
Q55: The following table includes the information about
Q56: Quarterly sales of a department store for
Q65: Which of the following models is not