Essay
Quarterly sales of a department store for the last seven years are given in the following table. 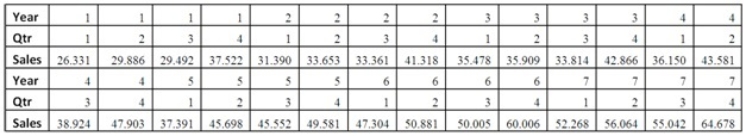
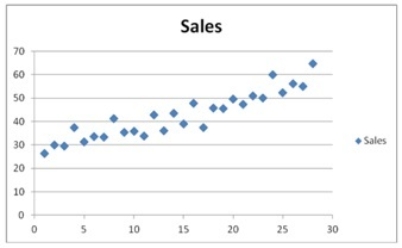 The Excel scatterplot shown indicates that the quarterly sales have an increasing trend and seasonality.Therefore,the linear regression model,Sales = β0 + β1Qtr1 + β2Qtr2 + β3Qtr3 + β4t + ε,with three seasonal dummy variables Qtr1,Qtr2,and Qtr3,and the decomposition method are proposed to make sales forecasts.For the regression model,the following Excel partial output is available.
 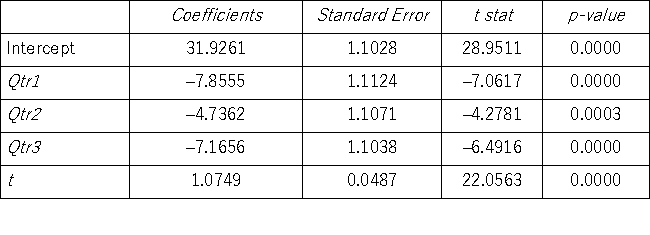 Using the regression equation for the linear trend model with seasonal dummy variables,what can be said about the sales in Quarter 4 compared to the sales in Quarter 1?
Correct Answer:

Verified
A linear trend model with seasonal dummy...View Answer
Unlock this answer now
Get Access to more Verified Answers free of charge
Correct Answer:
Verified
View Answer
Unlock this answer now
Get Access to more Verified Answers free of charge
Q18: Ideally, the chosen model is best in
Q46: All criteria used for selecting the best
Q47: Based on quarterly data collected over the
Q49: The following table includes the information about
Q50: The following table includes the information about
Q50: The optimal value of the speed of
Q52: The following table shows the annual revenues
Q54: Quarterly sales of a department store for
Q55: The following table includes the information about
Q56: Quarterly sales of a department store for